What Is the Pi Cycle Top Indicator?
The Bitcoin Pi Cycle Top Indicator is a tool used by traders and analysts to predict when Bitcoin’s price may have reached its peak, or “cycle top,” during a bull market. It’s based on the relationship between two moving averages: the 111-day moving average and the 350-day moving average multiplied by two. When these two lines cross, it has historically indicated that Bitcoin’s price is near its maximum value before a significant correction.
Breaking Down the Moving Averages
Moving averages are simply the average of Bitcoin’s price over a certain period. In this case:
- 111-Day Moving Average: This represents the average Bitcoin price over the last 111 days. It reacts quickly to price changes, so it follows Bitcoin’s price more closely.
- 350-Day Moving Average x 2: This is the 350-day moving average multiplied by two. It moves more slowly because it takes into account a longer period of time, making it less responsive to short-term price fluctuations.
How Does It Work?
Historically, the Pi Cycle Top Indicator signals a market peak when the 111-day moving average crosses above the 350-day moving average multiplied by two. Each time this happens, the price of Bitcoin tends to be at or near its highest point, followed by a sharp decline or “market correction.”
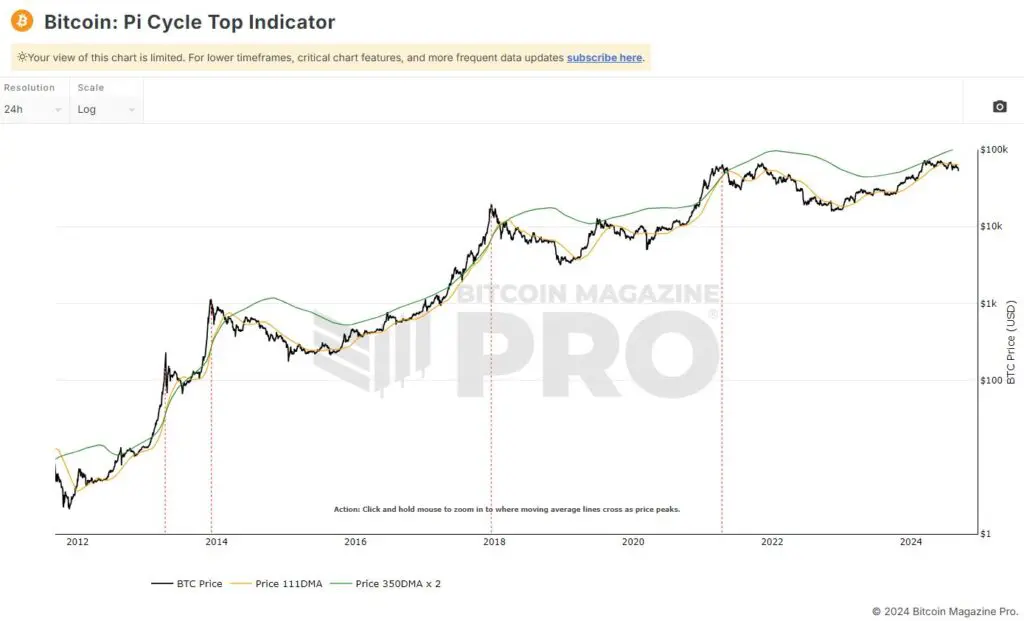
In the chart provided, you can see three key moments when the two moving averages crossed:
- 2013 Peak: The indicator signaled a top when Bitcoin’s price reached around $1,000.
- 2017 Peak: Another top was signaled when Bitcoin reached nearly $20,000.
- 2021 Peak: The indicator also captured Bitcoin’s peak at around $65,000.
After each of these peaks, Bitcoin’s price significantly corrected, making the Pi Cycle Top Indicator a valuable tool for predicting when the market is overheated.
Why Is This Important for Investors?
For investors and traders, identifying the top of a market cycle is crucial to avoid buying at the peak or holding on too long before a major price correction. The Pi Cycle Top Indicator provides a historical pattern that can help investors time their decisions more effectively.
However, it’s important to remember that no indicator is perfect. The Pi Cycle Top Indicator cannot guarantee the prediction of every market top, so use its signals alongside other tools and analysis to gain a well-rounded view of the market.
Current State of the Indicator
As of the most recent data on the chart, the two moving averages have not crossed again since the last top in 2021. This suggests that, according to this indicator, Bitcoin has not yet reached a new market top. Investors should continue to monitor these moving averages to anticipate any potential future peaks.
Conclusion
The Pi Cycle Top Indicator helps identify Bitcoin’s price cycle peaks and should complement a broader strategy. By analyzing the interaction between the 111-day and 350-day moving averages, investors can gain insights into potential overbought conditions and corrections. While not foolproof, it has historically provided accurate signals that align with Bitcoin’s major price tops, making it a valuable resource for long-term investors and traders alike.
Disclosures: Not investment advice. The Author, Sarson Funds, Inc. and its affiliated managers may hold positions in the projects mentioned. Talk with your financial advisor before making any investment decisions or have them contact Sarson Funds directly at [email protected].